Showing posts with label CPI-IW. Show all posts

Thursday, 31 August 2017

AICPIN for the month of July 2017 - 5 Points Increased (285)


AICPIN for the month of July 2017 - 5 Points Increased (285)

Consumer Price Index for Industrial Workers (CPI-IW) - July 2017

The All India CPI-IW for July, 2017 increased by 5 points and pegged at 285.

The Index increased by 1.79% between June, 2017 and July, 2017 when compared with the increase of 1.08% for the corresponding months of last year.

No. 5/1/2017-CPI
GOVERNMENT OF INDIA
MINISTRY OF LABOUR & EMPLOYMENT
LABOUR BUREAU
CLEREMONT, SHIMLA-171004
DATED: 31st August, 2017
Press Release

Consumer Price Index for Industrial Workers (CPI-IW) - July 2017

The All-India CPI-IW for July, 2017 increased by 5 points and pegged at 285 (two hundred and eighty five). In terms of monthly change, it increased by (+) 1.79 per cent between June, 2017 and July, 2017 when compared with the increase of (+) 1.08 per cent for the corresponding months of last year.

 The maximum upward pressure to the change in current index came from Food group contributing (+) 3.12 percentage points to the total change. The House Rent index further accentuated the overall index by (+) 0.70 percentage points. At item level, Rice, Pure Ghee, Chillies (Green), Onion, Bitter Gourd, Brinjal, Gourd, Lady’s Finger, Palak, Parwal, Potato, Pumpkin, Tomato, Torai, Banana, Cucumber, Mango, Tea (Readymade), Bidi, Cooking Gas, Kerosene Oil, etc. are responsible for the increase in index. However, this increase was checked by Wheat, Arhar Dal, Masur Dal, Urd Dal, Coconut Oil, Mustard Oil, Poultry (Chicken), Coconut, Lemon, Petrol, etc., putting downward pressure on the index.

The year-on-year inflation measured by monthly CPI-IW stood at 1.79 per cent for July, 2017 as compared to 1.08 per cent for the previous month and 6.46 per cent during the corresponding month of the previous year. Similarly, the Food inflation stood at (-) 0.32 per cent against (-) 1.28 per cent of the previous month and 9.34 per cent during the corresponding month of the previous year.

At centre level, Jamshedpur reported the maximum increase of 12 points followed by Delhi and Ranchi- Hatia (11 points each), Raniganj and Jaipur (10 points each) and Varanasi and Amritsar (9 points each). Among others, 8 points increase was observed in 2 centres, 7 points in 7 centres, 6 points in 7 centres, 5 points in 11 centres, 4 points in 10 centres, 3 points in 13 centres, 2 points in 9 centres and 1 point in 5 centres. On the contrary, Goa recorded a decrease of 1 point. Rest of the 6 centres indices remained stationary.

The indices of 34 centres are above All-India Index and 42 centres indices are below national average. The indices of Amritsar and Lucknow centres remained at par with All-India Index.

The next issue of CPI-IW for the month of August, 2017 will be released on Friday, 29th September, 2017. The same will also be available on the office website www.labourbureaunew.gov.in.

(SHYAM SINGH NEGI)
DEPUTY DIRECTOR GENERAL

AICPIN-EXPECTED-DA-FROM-January-2018

Wednesday, 1 February 2017

AICPIN for the month of December 2016


AICPIN for the month of December 2016

No. 5/1/2014- CPI
GOVERNMENT OF INDIA
MINISTRY OF LABOUR & EMPLOYMENT
LABOUR BUREAU


CLEREMONT, SHIMLA-171004
DATED: 31st January, 2017
 Press Release

Consumer Price Index for Industrial Workers (CPI-IW)-December, 2016

The All-India CPI-IW for December, 2016 by 2 points and stood 275 (two hundred and seventy five). On 1-month percentage change, it decreased by (-) 0.72 per cent November and December, 2016 when compared with the decease of (-) 0.37 per cent between the same two months a year ago.

The maximum downward pressure to the change in current index came from Food group conuibuting (-) 2.74 percentage points to the total change. At item level, Arhar Dal, Gram Dal, Masur Dal, Urd Dal, Groundnut Oil, Muslard Oil, Chillies Green, Ginzer, Brinjal, Cabbage, Carrot, Cauliflower, French Beans, Gourd, Green Coriander Leaves, Methi, Palak, Peas, Potato, Radish, Tomato, Banana, Lemon, etc. are responsible for the decrease in index. However, this decrease checked by Rice, Wheal, Wheat Alta, Coconut OiL Fish Fresh, Goat Meat, Milk Snack Saltish, Cooking Gas, ESI Premium Contribution, Petrol, Flowe/Flower Garlands, Toilet Soap, etc., putting upward on the index.

The year-on-year inflation measured by monthly CPI-IW stood at 2.23 per cent for December, 2016 as compared to 2.59 per cent for the pervious month and 6.32 per cent during the corresponding month of the previous year. Similarly, the Food inflation stood at 0.67 per cent against 1.66 per cent of the previous month and 7.94 per cent during the corresponding month or the previous year.

At centre level, Rourkela reported the maximum decrease or 10 points followed by Vadodara (9 points), Nagpur and Lucknow (8 points each) and Amritsar, Varanasi and Monger Jamalpur (6 points each). Among others, 5 points decrease was observed in 7 centres, 4 points in 12 centres, 3 points in 9 centres, 2 points in 15 centres and 1 point in 10 centres. On the contrary, Quilon recorded maximum increase of 6 points followed by Ernakulam and Mundakkayam (3 points each). Among others, 2 points increase was observed in 4 centres and 1 point in 4 centres. Rest or the 7 centres indices remained stationary.

The indices or centres are above All-India Index and other 43 centres indices are below national average. The index or Vishakhapathnam centre remained at par with All-India Index. The next or CPI-IW fer the month of January, 2017 will be released on Tuesday, 28th February, 2017. The same will also be available on the office website www.labourbureaunew.gov.in

sd/-
(SHYAM SINGH NEGI)
DEPUTY DIRECTOR GENERAL
Authority: www.labourbureaunew.gov.in

Monday, 4 January 2016

Expected DA from January 2016 – 2 Point increase in December 2015 may change 7th Pay Commission fitment formula

Expected DA from January 2016 and its impact on 7th Pay Commission Pay fixation formula and Multiplication Factor – If CPI-IW for December reaches 272 then 7th Pay Commission multiplication factor will have to be revised to 2.58

Expected DA from January 2016 – 2 Point increase in December 2015 may change 7th Pay Commission fitment formula

Expected DA from January 2016 – Two Point increase in CPI for Dec 2015 could take it to 126% which is 1% more than what was reckoned for 7th Pay Commission revised Pay fixation.

If DA from January 2016 touches 126%, 7th Pay Commission fitment formula and Multiplication factor of 2.57 may require upward revision

Consumer Price Index (Industrial Workers) for the month of November 2015 has been released recently by Govt. We have one point increase in CPI for November 2015 which has moved from 269 to 270.

Consumer Price Index from January 2015 to November 2015

Month Actual AICPI-IW
Jan-2015 254
Feb-2015 253
Mar-2015 254
Apr-2015 256
May-2015 258
Jun-2015 261
July-2015 263
Aug-2015 264
Sep-2015 266
Oct-2015 269
Nov-2015 270
Dec-2015 Not released

DA from January 2016 – Estimation for 125%:

estimated-DA-expectedDA-dearness-allowance


DA from Jan 2016= [(254+253+254+256+258+261+263+264+266+269+270+258)-115.76]*100/115.76
= 125 % (6% increase in DA from Jan 2016)

Based on actual CPI-IW for 11 months from January 2015 to November 2015 which span from 254 to 270 and estimated index for the month of December 2015, it is almost certain that Dearness Allowance from January 2016 payable to Central Government Employees including Railway Employees and Defence Personnel will not be less than 125% (6% increase).

Even a 12 point fall in CPI-IW from 270 to 258 in December 2015 will not affect the DA from January 2016 clocking 125%.

DA from January 2016 – Estimation for 126%:


Our Proposition discussed in the earlier article on the chances for DA from January 2015 reaching 126% (7% increase) still holds good as two point increase in the CPI-IW in December 2015 would take DA from January 2016 to 126%.


DA from January 2016 126%

DA from Jan 2016= [(254+253+254+256+258+261+263+264+266+269+270+272)-115.76]*100/115.76
= 126 % (7% increase in DA from Jan 2016)

DA from January 2016 – Estimation for 127%:


At the same time possibility of DA from January 2016 reaching 127% or more is remote as CPI-IW has to reach 286 in December 2015 from the present level of 270 for getting DA of 127%.

DA from Jan 2016= [(254+253+254+256+258+261+263+264+266+269+270+286)-115.76]*100/115.76
= 127% (8% increase in DA from Jan 2016)


So, DA from January 2016 will be either 125% (6% increase) or 126% (7% increase). One might think that 1% additional DA from January 2016 is negligible. However, it will be 1% more than what was reckoned for 7th Pay Commission revised Pay fixation.

7th Pay Commission has estimated DA from January 2016 as 125% for the purpose of Revision of Pay and Allowances

Now, if Consumer Price Index (Industrial workers) for the month of December 2015 reaches 172 from the present level of 170, it is certain that DA from January 2016 will be 126%. In that case, 7th Pay Commission pay fitment formula and allowances which are DA indexed will have to be revised accordingly.

For instance, 7th Pay Commission’s uniform multiplication factor of 2.57 includes a factor of 2.25 on account of DA neutralisation, assuming that the rate of Dearness Allowance would be 125 percent at the time of implementation of the new pay. If DA from January 2016 reaches 126% then this multiplication factor will have to revised as 2.58.

Source: gconnect

Friday, 30 October 2015

Expected DA January 2016 – AICPIN for September 2015

Expected DA January 2016 – AICPIN for September 2015

No.5/1/2015-CPI
GOVERNMENT OF INDIA
MINISTRY OF LABOUR & EMPLOYMENT
LABOUR BUREAU
CLEREMONT, SHIMLA-171004
DATED : 30th October, 2015
Press Release
Expected DA January 2016 – AICPIN for September 2015

Consumer Price Index for Industrial Workers (CPI-IW) – September, 2015

The All-India CPI-IW for September, 2015 increased by 2 points and pegged at 266 (two hundred and sixty six). On 1-month percentage change, it increased by (+) 0.76 per cent between August and September, 2015 which was static between the same two months a year ago.

The maximum upward pressure to the change in current index came from Food group contributing (+) 1.78 percentage points to the total change. At item level, Arhar Dal, Masur Dal, Moong Dal, Urd Dal, Mustard Oil, Onion, Cauliflower, Green Coriander Leaves, Potato, Tea (Readymade), Sugar, Electricity Charges, Private Tuition Fee, Flower/Flower Garlands, etc. are responsible for the increase in index. However, this increase was restricted by Wheat, Fish Fresh, Poultry (Chicken), Eggs (Hen), Apple, Coconut, Tomato, Petrol, Washing Soap, etc., putting downward pressure on the index.

The year-on-year inflation measured by monthly CPI-IW stood at 5.14 per cent for September, 2015 as compared to 4.35 per cent for the previous month and 6.30 per cent during the corresponding month of the previous year. Similarly, the Food inflation stood at 5.71 per cent against 3.55 per cent of the previous month and 6.46 per cent during the corresponding month of the previous year.

At centre level, Chhindwara reported the highest increase of 10 points followed by Varanasi (9 points), Pune, Tripura, Jalpaiguri and Bhilwara (6 points each). Among others, 5 points rise was observed in 5 centres, 4 points in 7 centres, 3 points in 8 centres, 2 points in 16 centres and 1.point in 19 centres. On the contrary, Goa recorded a maximum decrease of 4 points followed by Ernakulam 3 points. Among others, 2 points decrease was observed in 4 centres and 1 point in 2 centres. Rest of the 9 centres’ indices remained stationary.

The indices of 36 centres are above All India Index and other 42 centres’ indices are below national average.

The next issue of CPI-IW for the month of October, 2015 will be released on Monday, 30th November, 2015. The same will also be available on the office website www. labourbureau.gov. in.

(S.S.NEGI)
DEPUTY DIRECTOR GENERAL
Authority: http://labourbureau.nic.in/

Sunday, 31 May 2015

AICPIN for the month of April 2015

AICPIN for the month of April 2015
No. 5/1/2015- CPI
GOVERNMENT OF INDIA
MINISTRY OF LABOUR & EMPLOYMENT
LABOUR BUREAU
`CLEREMONT’, SHIMLA-171004
DATED : 29th May, 2015
Press Release

Consumer Price Index for Industrial Workers (CPI-IW) – April, 2015

The All-India CPI-IW for April, 2015 increased by 2 points and pegged at 256 (two hundred and fifty six). On 1-month percentage change, it increased by (+) 0.79 per cent between March, 2015 and April, 2015 when compared with the increase of (+) 1.26 per cent between the same two months a year ago.

The maximum upward pressure to the change in current index came from Food group contributing (+) 1.24 percentage points to the total change. At item level, Rice, Arhar Dal, Gram Dal, Urd Dal, Fish Fresh, Goat Meat, Poultry (Chicken), Milk (Buffalo & Cow), Vegetable & Fruit items, Tea (Readymade), Snack (Sweet & Saltish), Country Liquor, Electricity Charges, Doctor’s Fee, Private Tuition Fee, Tailoring Charges, etc. are responsible for the increase in index. However, this increase was restricted by Eggs (Hen), Onion, Chillies Green, Sugar, Petrol, Flower/Flower Garlands, etc., putting downward pressure on the index.

The year-on-year inflation measured by monthly CPI-IW stood at 5.79 per cent for April, 2015 as compared to 6.28 per cent for the previous month and 7.08 per cent during the corresponding month of the previous year. Similarly, the Food inflation stood at 5.68 per cent against 6.98 per cent of the previous month and 7.76 per cent during the corresponding month of the previous year.

At centre level, Srinagar reported the highest increase of 9 points followed by Bhilai (5 points). Among others, 4 points increase was observed in 14 centres, 3 points in 9 centres, 2 points in 14 centres and 1 point in 18 centres. On the contrary, Giridih centre recorded a maximum decrease of 6 points followed by Guntur (3 points) and Ranchi-Hatia and Godavarikhani (2 points each). Among others, 1 point decrease was observed in 8 centres. Rest of the 9 centres’ indices remained stationary.

The indices of 36 centres are above All India Index and other 42 centres’ indices are below national average.

The next index of CPI-IW for the month of May, 2015 will be released on Tuesday, 30th June, 2015. The same will also be available on the office website www.labourbureau.gov.in.
sd/-
(S.S.NEGI)
Director
Source: http://www.labourbureau.gov.in/Press%20Note%20English%20Apr%202015.pdf

Thursday, 1 January 2015

Expected DA from Jan 2015 – AICPIN for the month of September 2014

Expected DA from Jan 2015 – AICPIN for the month of September 2014
No.5/1/2014- CPI
GOVERNMENT OF INDIA
MINISTRY OF LABOUR & EMPLOYMENT
LABOUR BUREAU
‘CLEREMONT’, SHIMLA-171004:
Dated the 31st October, 2014
Press Release
Consumer Price Index for Industrial Workers (CPI-IW) – September, 2014

The All-India CPI-IW for September, 2014 remained stationary at 253 (two hundred and fifty three). On 1-month percentage change, it remained stalic between August, 2014 and September, 2014 when compared with the rise of 0.42 per cent between the same two months a year ago.

The largest downward pressure to the change in current index came from Food group contributing (-) 1.04 percentage points to the total change. At item level, Fish Fresh, Poultry (Chicken), Chitlies Green, Ginger, Onion, Tomato, Brinal, French Beans, Lady’s Finger, Apple, Sugar, Medicine (Allopathie), Petrol, etc. are responsible for the decrease in index.

However, this decrease was restricted to sore extent by Rice, Wheat Atta, Arhar Dal, Potato, Cauliflower, Tea (Readymade), Snack Saltish, Bidi, Cigarette, Electricity Charges, Cinema Charges, Toilet Soap, Tailoring charges. etc.. putting upward pressure on the index.

The year-on-year inflation measured by monthly CPI-IW stood at 6.30 per cent tbr September, 2014 as compared to 6.75 per cent for the previous month and 10.70 per cent during the corresponding month of the previous year. Similarly, the Food inflation stood at 6.46 per cent against 7.63 per cent of the previous month and 13.36 per cent during the corresponding month of the previous year.

At centre level, Goa reported a decrease of 10 points followed by Nagpur (5 points). Among others, 4 points fall was observed in 6 centres, 3 points in 4 centres, 2 points in 9 centres and 1 point in 19 centres.
On the contrary, Tripura recorded the maximum increase of 6 points followed by Lucknow & Jalpaiguri (4 points each) and Rourkela & Rangapara-Tezpur (3 points each). Among others, 2 points rise was registered in 8 centres and 1 point in 12 centres. Rest of the 13 centres’ indices remained stationary.

The indices of 37 centres are above and other 41 centres’ indices are below national average.

The next index of CPI-IW fut the month of October, 2014 will be released on Friday, 28 November. 2014.
The sanie will also be available on the office website www.labourbureau.gov.in
sd/-
(S.S.NEGI)
Director
Expected DA from Jan 2015 – AICPIN for the month of September 2014
No.5/1/2014- CPI
GOVERNMENT OF INDIA
MINISTRY OF LABOUR & EMPLOYMENT
LABOUR BUREAU
‘CLEREMONT’, SHIMLA-171004:
Dated the 31st October, 2014
Press Release
Consumer Price Index for Industrial Workers (CPI-IW) – September, 2014
The All-India CPI-IW for September, 2014 remained stationary at 253 (two hundred and fifty three). On 1-month percentage change, it remained stalic between August, 2014 and September, 2014 when compared with the rise of 0.42 per cent between the same two months a year ago.
The largest downward pressure to the change in current index came from Food group contributing (-) 1.04 percentage points to the total change. At item level, Fish Fresh, Poultry (Chicken), Chitlies Green, Ginger, Onion, Tomato, Brinal, French Beans, Lady’s Finger, Apple, Sugar, Medicine (Allopathie), Petrol, etc. are responsible for the decrease in index.
However, this decrease was restricted to sore extent by Rice, Wheat Atta, Arhar Dal, Potato, Cauliflower, Tea (Readymade), Snack Saltish, Bidi, Cigarette, Electricity Charges, Cinema Charges, Toilet Soap, Tailoring charges. etc.. putting upward pressure on the index.
The year-on-year inflation measured by monthly CPI-IW stood at 6.30 per cent tbr September, 2014 as compared to 6.75 per cent for the previous month and 10.70 per cent during the corresponding month of the previous year. Similarly, the Food inflation stood at 6.46 per cent against 7.63 per cent of the previous month and 13.36 per cent during the corresponding month of the previous year.
At centre level, Goa reported a decrease of 10 points followed by Nagpur (5 points). Among others, 4 points fall was observed in 6 centres, 3 points in 4 centres, 2 points in 9 centres and 1 point in 19 centres. On the contrary, Tripura recorded the maximum increase of 6 points followed by Lucknow & Jalpaiguri (4 points each) and Rourkela & Rangapara-Tezpur (3 points each). Among others, 2 points rise was registered in 8 centres and 1 point in 12 centres. Rest of the 13 centres’ indices remained stationary.
The indices of 37 centres are above and other 41 centres’ indices are below national average.
The next index of CPI-IW fut the month of October, 2014 will be released on Friday, 28 November. 2014.
The sanie will also be available on the office website www.labourbureau.gov.in
sd/-
(S.S.NEGI)
Director

Friday, 18 April 2014

Expected DA from January 2014 - AICPIN for the month of December 2013 : All-India CPI-IW for December, 2013 declined by 4 points and pegged at 239 (two hundred and thirty nine).

 Expected DA from January 2014 - AICPIN for the month of December 2013 : All-India CPI-IW for December, 2013 declined by 4 points and pegged at 239 (two hundred and thirty nine).

As per the press release of Labour Bureau the Consumer Price Index(IW) fell down by four points from the existing level of 243 and now it stands at 239. However the percentage of additional dearness allowance for Central Government employees and Pensioners from January 2014 will be 10% and the total dearness allowance will become 100%.

The press release said that the percentage contribution of food group is declaimed by 4.96 and the inflation also downward pressure to 9.13 per cent against compare with the previous month of 11.47 per cent.

Most of the Central employees are excepted the index will go higher than three percent, because of the additional dearness allowance will climb to 11%.

But it happened in reverse direction, declined by four points. However the balance percentage will be added in the next dearness allowance calculation.

And now started to expect next installment of additional dearness allowance from July 2014. Although it is too early to predict, the percentage of additional DA from July 2014 will be minimum 7%.

Press Information Bureau
Government of India
Ministry of Labour & Employment

31-January-2014 18:25 IST


Consumer Price Index Numbers for Industrial Workers (CPI-IW) December 2013

According to a press release issued by the Labour Bureau, Ministry of Labour & Employment the All-India CPI-IW for December, 2013 declined by 4 points and pegged at 239(two hundred and thirty nine). On 1-month percentage change, it decreased by 1.65 per cent between November and December compared with the rise of 0.46 per cent between the same two months a year ago.

The largest downward pressure to the change in current index came from Food group contributing -4.96 percentage points to the total change. At item level, Onion, Ginger, Chillies Green, Brinjal, Cauliflower, Cabbage, Peas, Tomato, Potato and other Vegetable items, Sugar etc. are responsible for the decrease in index. However, this was compensated to some extent by Fish Fresh, Eggs, Hen, Poultry, Milk, Pure Ghee, Garlic, Firewood, ESI Contribution, etc. putting upward pressure on the index.

The year-on-year inflation measured by monthly CPI-IW stood at 9.13 per cent for December, 2013, as compared to 11.47 per cent for the previous month and 11.17 per cent during the corresponding month of the previous year. Similarly, the Food inflation stood at 11.49 per cent against 16.17 per cent of the previous month and 13.53 per cent during the corresponding month of the previous year.

At centre level, Giridih recorded the highest decline of 12 points each followed by Ahmedabad, Chhindwara, Varanasi, Munger, Jamalpur, Nagpur and Bhavnagar (10 points each).Jamshedpur (09 points), Rourkela, Ludhiana, Tripura and Angul Talcher (08 points each) Among others, 7 points decrease was registered in 9 centres, 6 points in 8 centres, 5 points in 11 centres, 4 points in 8 centres, 3 points in 7 centres, 2 points in 9 centres and 1 point in 7 centres. On the contrary, Sholapur centre reported an increase of 4 points followed by Puducherry (2 points), Coimbatore and Srinagar centres 1 point each. Rest of the 3 centres’ indices remained stationary.

The indices of 37 centres are above All-India Index and other 38 centres’ indices are below national average. The index of Varanasi and Vijaywada centre remained at par with all-India index.

The next index of CPI-IW for the month of January, 2014 will be released on Friday, 28 February, 2014.

The same will also be available on the office website www.labourbureau.gov.in.

Source: PIB News

Thursday, 17 April 2014

Expected DA from Jan 2014 - AICPIN for the month of October 2013

Expected DA from Jan 2014 - AICPIN for the month of October 2013
Consumer Price Index Numbers for Industrial Workers (CPI-IW) October 2013 
Press Information Bureau 
Government of India
Ministry of Labour & Employment 
29-November-2013 18:49 IST
Consumer Price Index Numbers for Industrial Workers (CPI-IW) October 2013 
According to a press release issued by the Labour Bureau, Ministry of Labour & Employment the All-India CPI-IW for October, 2013 rose by 3 points and pegged at 241 (two hundred and forty one). On 1-month percentage change, it increased by 1.26 per cent between September and October compared with 0.93 per cent between the same two months a year ago. 

The largest upward pressure to the change in current index came from Food group contributing 2.53 percentage points to the total change. At item level, Rice, Wheat Atta, Fish Fresh, Goat Meat, Milk (Cow & Buffalo), Pure Ghee, Onion, Vegetable items, Tea Readymade, Electricity Charges, etc.. are responsible for the rise in index. However, this was compensated to some extent by Groundnut Oil, Ginger, Petrol, putting downward pressure on the index.
The year-on-year inflation measured by monthly CPI-IW stood at 11.06 per cent for October, 2013 as compared to 10.70 per cent for the previous month and 9.60 per cent during the corresponding month of the previous year. Similarly, the Food inflation stood at 15.02 per cent against 13.36 per cent of the previous month and 9.91 per cent during the corresponding month of the previous year.
At centre level, Bhavnagar recorded the highest increase of 9 points each followed by Ahmedabad, Labac Silchar and Kodarma (8 points each) and Vadodara and Surat (7 point each). Among others, 6 points rise was registered in 8 centres, 5 points in 10 centres, 4 points in 8 centres, 3 points in 9 centres, 2 points in 10 centres and 1 point in 11 centres. On the contrary, Belgaum and Chhindwada centres reported a decline of 3 points each followed by Mercara (2 points) and Salem, Hubli Dharwar and Puducherry (1 point each). Rest of the 15 centres’ indices remained stationary.
The indices of 39 centres are above All-India Index and other 38 centres’ indices are below national average. 
The next index of CPI-IW for the month of November, 2013 will be released on Tuesday, 31 December, 2013. The same will also be available on the office website www.labourbureau.gov.in. 

Flash News

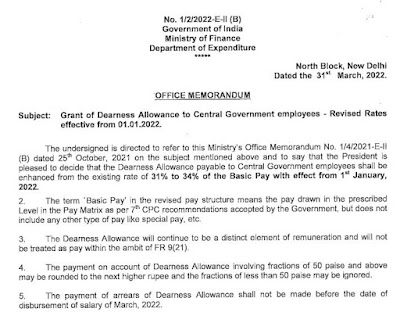
DA Jan 2022 - Grant of Dearness Allowance to Central Government employees - Revised Rates effective from 01.01.2022

 3% DA Hike - Revised Rates effective from 01.01.2022: DoE OM dated 31.03.2022 No. 1/2/2022-E-II (B) Government of India Ministry of Finance...